PEO Stats
A recent industry report was released by IBISWorld on the PEO industry with updated statistics through September 2018. This article is a snapshot of the highlights contained within that report followed with commentary by www.netprofitgrowth.com author and CEO of Business Resource Center, Rob Comeau.
Fast Facts
The PEO industry gross revenue for 2018 is projected at 176.3bn, of which an estimated $155.4bn represents work site employee (WSE) wages. Projected profit for the PEO industry in 2018 is $1.8bn. The projected annual growth rate from 2013 through 2018 in the PEO industry declined slightly to 8.1% from 9.0% in 2012 through 2017.[i]
Industry Structure
According to the report, it states that the industry life cycle stage is growth with revenue volatility being medium. Regulation is medium within the industry and barriers to entry are also considered medium. Competition levels are considered high while concentration level remains low and industry globalization is low.[ii]
Historic Industry Growth
Figure 1 illustrates the PEO industry growth from 2009 through 2018. As noted from previous reports, 2009 was the only negative growth year.[iii] This represents an average annual growth rate of 7.70% from 2005 through 2017. Figure 2 illustrates the industry’s growth by gross revenue with a year over year growth percentage overlay.
Figure 1
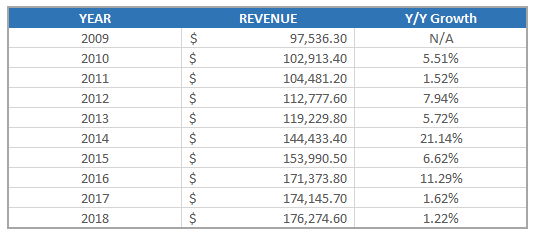
PEO Industry Growth 2009 – 2017
Figure 2
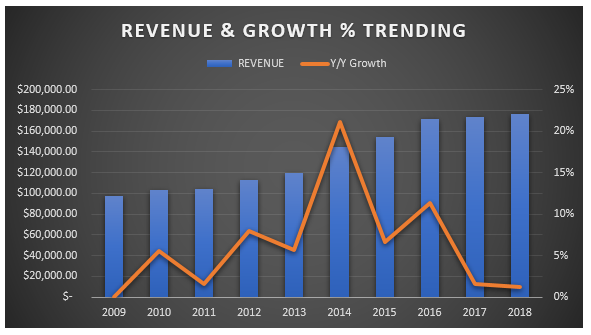
Revenue and year over year growth percentages
Projected Growth Rate
The report projects that the industry gross revenue will grow from 2018 through 2023 by an annualized rate of 0.40% to 180.04bn in 2023. [iv]
Market Segmentation
The market segmentation in the report shows the industry is roughly 2/3 white collar focused as illustrated in figure 3.
Figure 3
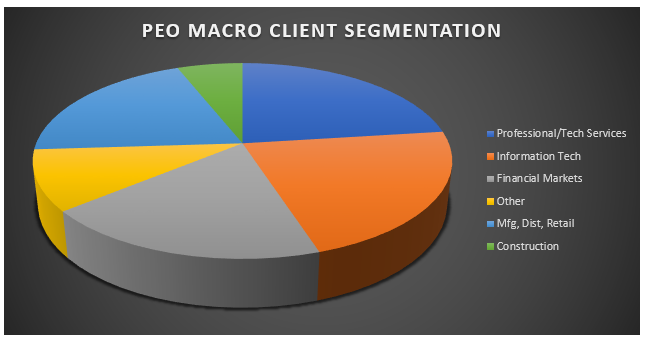
Macro client segmentation within the PEO industry as of 2018
Opinion/Commentary
The data in this article was pulled from the IBISWorld Industry Report 56133, Professional Employer Organizations in the United States. The below commentary is solely the opinion of the blog author; Rob Comeau, with respect to the information pulled from the report.
Major Players and Market Fragmentation
The market is considered fragmented with an estimated 700+ PEOs operating in the United States. However, revenue is less fragmented with the top 15 players likely controlling ¾ of the total gross revenue. With the major players, the industry continue to trend toward consolidation. Major players in the industry would include TriNet, ADP TotalSource, Insperity, Oasis, Paychex, and BBSI. Additional sizable PEOs would include CoAdvantage, Avitus, G&A Partners, Vensure, Pro Service, MBA, SEPLI, GMS, AlphaStaff, FrankCrum, Landrum, and others.
Industry Growth Projections
IBISWorld projects the industry to grow at an annualized rate of 0.4% from 2018 through 2023. I believe the industry will grow at a quicker pace. In the last couple of years when we have reviewed this report, actual revenues have come in higher than the report’s projections. The United States has been in the longest bull-market in decades. Moreover, access to capital is still relatively cheap. A bull-market and inexpensive capital courts organic and acquisition growth in the marketplace for SMBs. As SMBs grow, so do PEOs. Additionally, any major government regulatory changes will drive increase demand for PEO compliance services. As SMBs face increased competition and complexities, the value proposition for the PEO model continues to resonate.
An economic downturn and/or inflation can derail growth on a macro level within the PEO industry. However, as noted during the great recession, the PEO industry only had one negative year over year growth percentage (2009). If the United States experiences an economic downturn, the PEO industry will likely rebound more quickly than other industries. If history is an indicator, this would result in a reduction of same store sales (WSE reduction in existing clientele) followed by increased market penetration to offset same store sales reductions.
I estimate that the industry, on average, will grow by 1.00% to 3.00% annually between 2018 and 2023. If the market remains strong, capital remains inexpensive, and regulatory requirements for SMBs fluctuate, the average annual growth may be higher than 3.00%.
According to the recent NAPEO White Paper by McBassi & Company, the compounded annual growth rate of the PEO industry is roughly 14 times higher than the compounded annual growth rate of employment in the economy overall during the same period. [v]
Client Segmentation
Client segmentation in the PEO industry is roughly two-thirds white-collar focused. This trend toward targeting high wage, white-collar business is likely to continue. The United States has migrated from a manufacturing and production-based economy more toward a business services driven economy. The trend in PEO client segmentation mirrors this shift. However, if the larger players continue to target more white-collar segments, this may leave a competition gap for blue-collar centric PEOs thus creating an opportunity for the PEOs with a blue-collar focus.
Regulatory Impacts
PEO’s experienced a large uptick in revenue in 2014 because of ACA compliance requirements. Any major shifts in compliance requirements in the coming years may result in a macro spike in industry revenue.
Regarding voluntary third-party verification within the PEO industry, certification through CPEO and ESAC continue to provide legitimacy and confidence in PEO compliance and financial validation.
Potential Disruptors
Globalization does not appear to be a looming disruptor for the PEO industry. While the world is experiencing a trend toward a global economy, globalization in the PEO industry remains low. This is likely due to the size of PEO clientele. With an average client size of around 25 WSEs, the need for a global presence is limited. While SMBs may operate, sell, or procure on a global level, the necessity for a workforce to be global is limited. Exceptions to this will likely be in investment, tech, and banking clientele.
Automation will continue to be a potential disruptor within the industry. A.I. can change the way a PEO does business in the future. If A.I. can manage low level HR, safety, and administrative functions, early adopters may experience a reduction in overhead thus increasing profitability. However, with any early adoption, comes the first mover challenges. To date, predictive analytics are already being used within the industry for underwriting and claims forecasting.
[i] IBISWorld Industry Report 56133, Professional Employer Organizations in the United States
[ii] IBISWorld Industry Report 56133, Professional Employer Organizations in the United States
[iii] IBISWorld Industry Report 56133, Professional Employer Organizations in the United States
[iv] IBISWorld Industry Report 56133, Professional Employer Organizations in the United States
[v] An Economic Analysis: The PEO Industry Footprint in 2018