Opening
There are five publicly traded PEO players in the market; ADP TotalSource (ADP), Paychex/Oasis (PAYX), TriNet (TNET), Insperity (NSP), and Barrett Business Services (BBSI). Due to COVID-19, each of these stocks, like most industries, are currently down from recent historic levels. This article will cover the performance of PEO stocks through various timelines, compare and contrast performance, and provide insight into the potential outlook on the market.
Stock Comparison Overview
The following sections will compare the five publicly traded PEOs on various timelines, ranging from 5 years down to 1 month. Moreover, we will review how these PEO stocks have held up compared to the Down Jones Industrial Average (DJI) and the NASDAQ Composite (COMP) for a wider basis of reference. We also compared two of the PEO stocks against Tesla, Netflix, and Apple to gauge how they held up.
5-Year Stock Performance Comparison
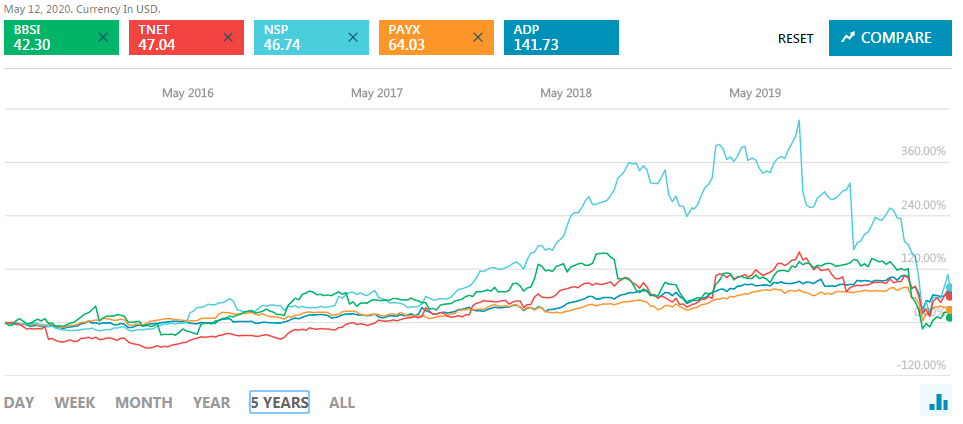
Figure 1 illustrates how the five publicly traded PEOs have compared against one another, while illustrating their starting stock price as of May 15th, 2015. Figure 2, illustrates the same timeline while providing their recent stock price as of May 12th, 2020. As you will note when comparing Figure 1 & 2, even with the current pandemic, stock prices for all five players are higher today than five years ago. Moreover, depending on when one bought & sold the stock, there were significant gains to be made, or significant losses if one timed the purchase/exit poorly.
Figure 1
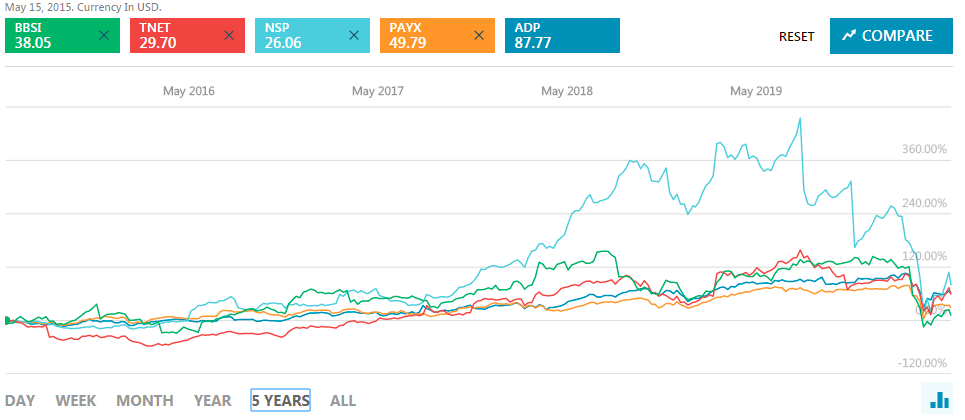
Figure 2
1-Year Stock Performance Comparison
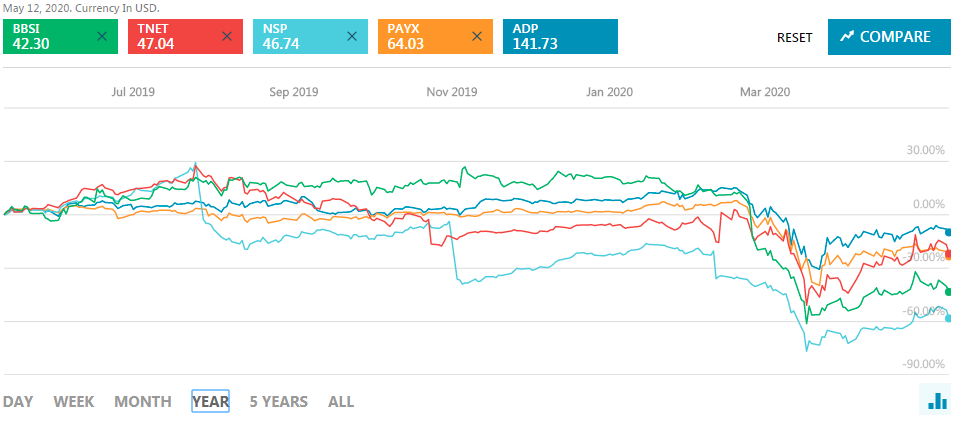
Figure 3 illustrates a one-year comparison of the PEO stocks, with their beginning stock values. Figure 4 covers the same timeline, but illustrates the ending stock values. As you will note in Figures 3 & 4, the highest gainers in the five-year comparison didn’t necessarily equate to the highest gainers in the 1-year comparison.
Figure 3
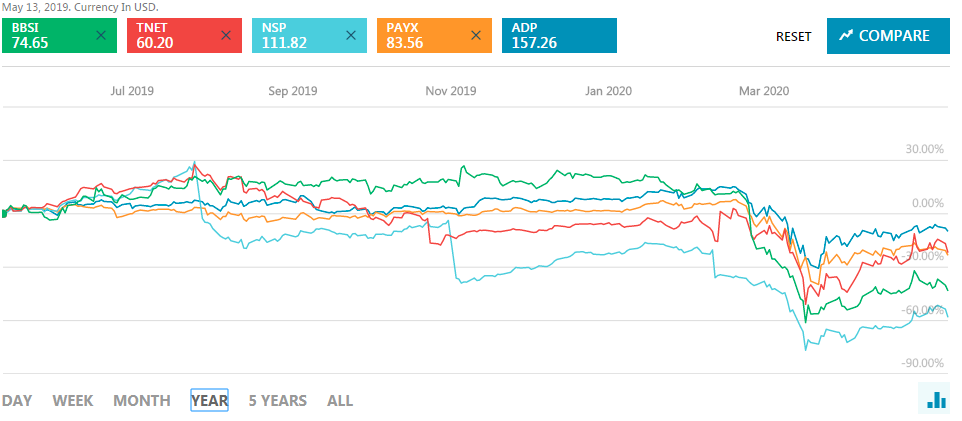
Figure 4
1-Month Stock Performance Comparison
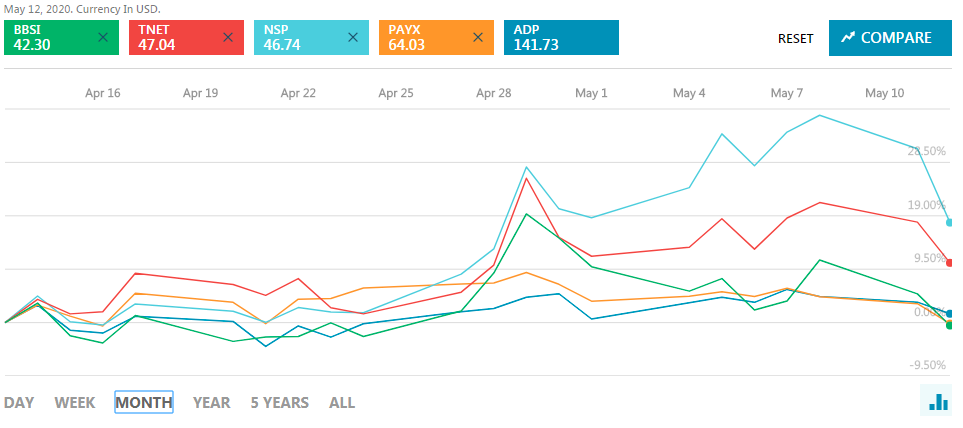
Figures 5 and 6 cover the last month’s trending for PEO stock performance, with beginning stock values and ending stock values, respectively. Again, the gainers have somewhat flipped when reviewing the stocks on the trailing 30 days as of May 12, 2020.
Figure 5
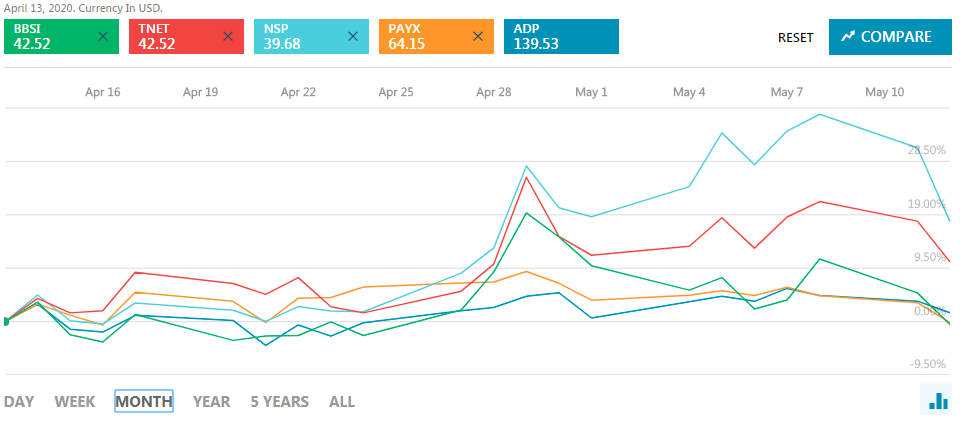
Figure 6
PEO Stocks vs. the DJI & COMP
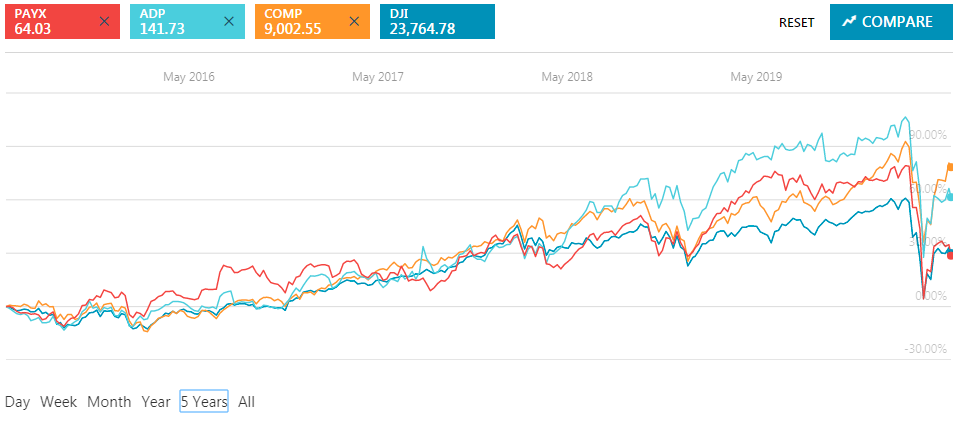
Figure 7 is a comparison of three PEO stocks (TNET, NSP, BBSI) versus the Dow Jones Industrial Average (DJI) and the NASDAQ Composite (COMP). Figure 8 is a comparison of the remaining two PEO stocks (ADP, PAYX) against the DJI and COMP.
While you will note that PEO stocks have typically met or outperformed these two composite indexes, there is a marked difference in performance between PEOs when categorized correctly. TriNet, Insperity, and BBSI are solely PEOs. ADP and Paychex are larger companies with PEO components. Due to the combination of company size and diverse offering, ADP and PAYX have remained closer to the trending of the DJI and COMP. Moreover, higher gains were available over the last five years if investments were made in TNET, NSP, or BBSI but higher volatility accompanied investments in those three stocks as well.
Figure 7
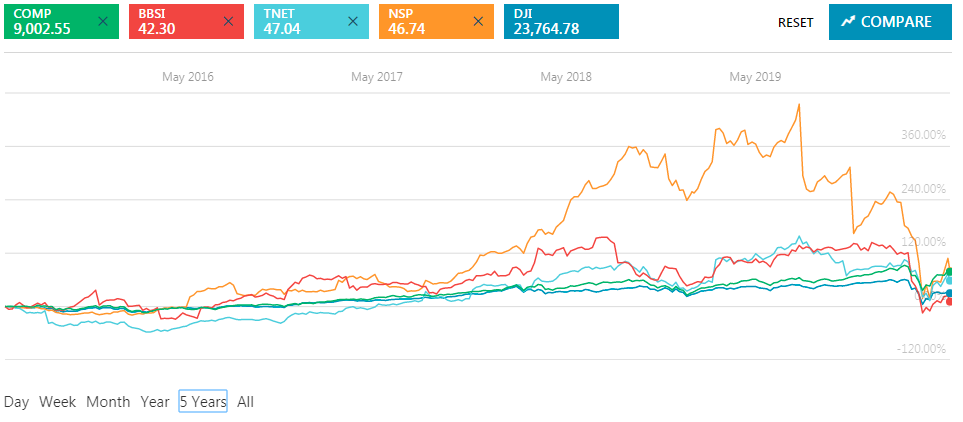
Figure 8
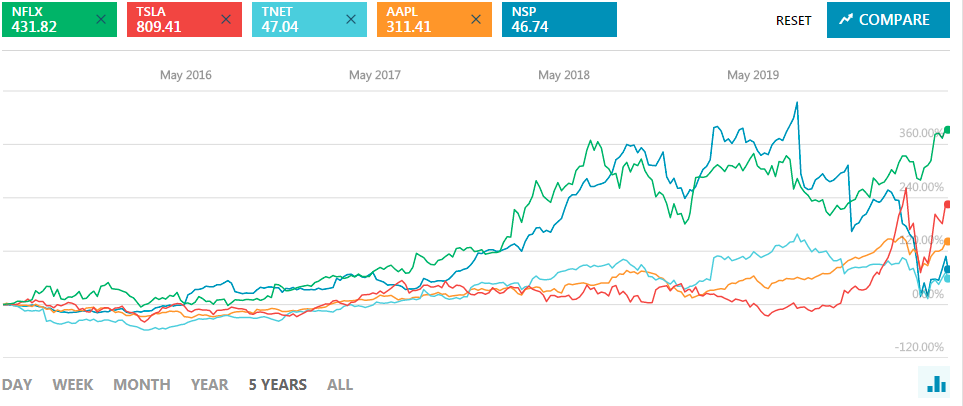
TNET & NSP versus Popular Stocks
We took a look at some of the more popular stocks which have experienced significant gains in recent years, i.e. Tesla, Netflix, and Apple. As you will note in Figure 9, we compared two of the higher gainers TNET and NSP with TSLA, NFLX, and AAPL. While in recent months, Tesla, Netflix, and Apple have outperformed Insperity and TriNet, historically the PEO stocks have held up well in this comparison. Insperity was mirroring gains and outperforming Netflix until late last year. TriNet was keeping pace or outperforming both Apple and Tesla until late last year. While these other three stocks are more widely known than TNET and NSP, it is obvious that there are gains to be made within the PEO industry stocks.
Figure 9
Final Thoughts
As you will note in the comparisons covered in this article, there is a solid upside to PEO stock growth. However, depending on the timing, there could be some valleys on the journey to higher gains. The diversified players (i.e. ADP and PAYX) have experienced less volatility than their peers (i.e. TNET, NSP, BBSI), but have also not reached the same heights in stock value gains. Moreover, until recent months, all five players have held their own against the composites (i.e. DJI and COMP) and have tracked well against well-known stocks such as TSLA, NFLX, and AAPL.
PEO revenues, to a large extent, are dependent on worksite employee (WSE) payroll. When payroll is down due to layoffs and furloughs, PEO revenues take a hit. However, reduced payrolls have always been temporary in a historical basis. Meaning, as payrolls rebound, so will PEO stocks. Moreover, we have covered four of the five players earnings releases recently, and most of them have had better Q1’s than expected and provided Q2 guidance that was more optimistic than I anticipated. Each of the earnings release coverage per player can be viewed at the links below:
- TriNet (TNET) – view earnings release coverage
- Insperity (NSP) – view earnings release coverage
- Barrett Business Services (BBSI) – view earnings release coverage
- ADP TotalSource (ADP) – view earnings release coverage
- Paychex (PAYX) – Paychex’s most recent quarter did not include months impacted by COVID-19 and therefore we will be conducting an earnings release review after their next earnings call which is scheduled for June.
When considering investment options, an investor should be cognizant that there are risks with any investment. Those risks should be weighed against the potential return. Many people are high on Tesla, Apple, and Netflix. Rightfully so, as these companies have posted impressive gains lately. However, do not discount PEO stocks. As noted in our comparisons, PEO stocks have held their own, and in some cases outpaced some of these well-known stocks. While PEO stocks may not be considered “sexy” investments, they can drive solid returns for those that invest in them.
Think of it this way, Bill Gates made his fortune in the tech industry. Tech is considered to be “sexy.” Warren Buffet made his fortune largely in insurance, not a sexy industry by most people’s standards. While tech may be sexy, the fail rate is high. PEOs provide investors the ability to experience high returns, typically with less volatility than many tech stocks.
Finally, the PEO industry historically rebounds more quickly than most industries during economic cyclicality, as noted in Figure 1 of our most recent Industry Statistics article. PEO stocks are currently priced low compared to historic levels. While there has been some volatility within the PEO stock base, especially recently with COVID-19, this may prove to be an ideal buying time for those in a position to invest.
Author
Rob Comeau is the Featured Author of this publication and serves as the CEO of Business Resource Center, Inc., a business consulting and M&A advisory firm within the PEO industry. To contact Rob, you may email him at rob.comeau@biz-rc.com. You may view BRCI’s offering at www.biz-rc.com.

