Investment interest has grown in the PEO industry. Whether it be through acquisitions via private equity firms or institutional investments into publicly traded PEOs, interest in the industry has grown. While the industry has been building for the last thirty to forty years, on a macro level, many investors have limited knowledge in the space. This is surprising for an industry whose total gross revenues are projected to surpass $176 billion for 2018.
This article will compare trending of publicly traded PEOs with the Dow Jones Industrial Average. It will also provide insight into the financial of publicly traded PEOs pulled from their SEC filings.
Dow Jones Industrial Average
When finance television programs discuss whether the market is “up or down today” they are generally referring to the Dow Jones Industrial Average. The Dow Jones is a price weighted average of thirty significant stocks traded on the market. Figure 1 provides the names and ticker symbols of the thirty stocks that currently comprise the Dow Jones.
Figure 1
| DOW JONES 30 COMPANIES | |
| SYMBOL | COMPANY NAME |
| MMM | 3M |
| AXP | AMERICAN EXPRESS |
| AAPL | APPLE |
| BA | BOEING |
| CAT | CATEPILLAR |
| CVX | CHEVRON |
| CSCO | CISCO |
| KO | COCA COLA |
| DIS | DISNEY |
| DWDP | DOW DUPONT |
| XOM | EXXON MOBILE |
| GS | GOLDMAN SACHS |
| HD | HOME DEPOT |
| IBM | IBM |
| INTC | INTEL |
| JNJ | JOHNSON & JOHNSON |
| JPM | JPMORGAN CHASE |
| MCD | MCDONALDS |
| MRK | MERCK |
| MSFT | MICROSOFT |
| NKE | NIKE |
| PFE | PFIZER |
| PG | PROCTOR & GAMBLE |
| TRV | TRAVELERS COMPANIES |
| UTX | UNITED TECHNOLOGIES |
| UNH | UNITED HEALTH |
| VZ | VERIZON |
| VZ | VISA |
| WMT | WAL-MART |
| WBA | WALGREEN |
The Dow Jones has outperformed the NYSE composite in valuation percentage growth when reviewing in increments of one year, five years, and fifteen years. However, the NASDAQ Composite has outperformed the Dow Jones respectively in the aforementioned time frames in stock percentage growth.
Public PEOs Comparison with Dow Jones Trending
As you will note from Figure 1, the Dow Jones is comprised of successful well-known investments. The Dow sets a solid bar in which to compare investments in the PEO industry. We are only using publicly traded PEOs in this basis of comparison as private company financials are not public knowledge. However, publicly traded PEOs represent over half of total industry revenues so the sample size is sufficient.
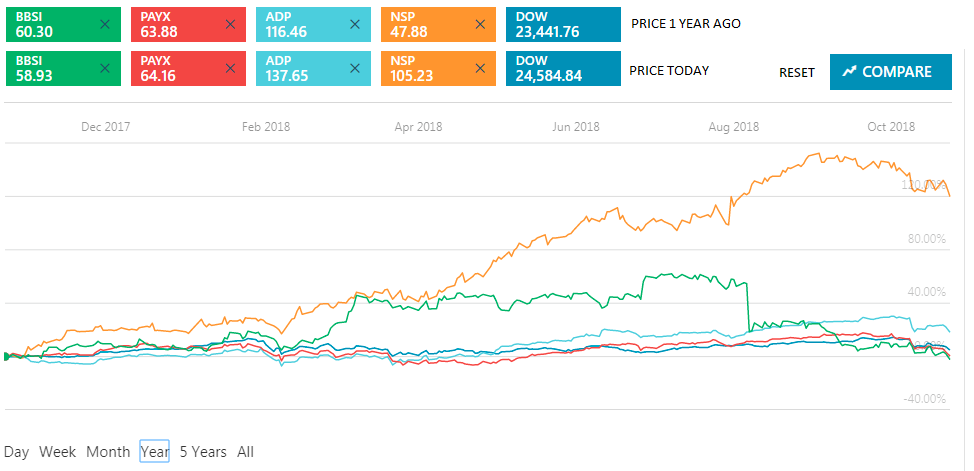
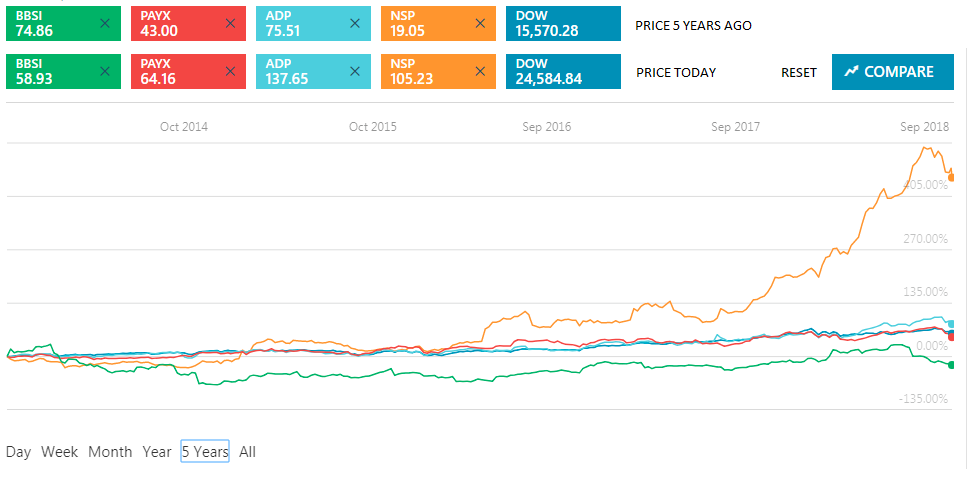
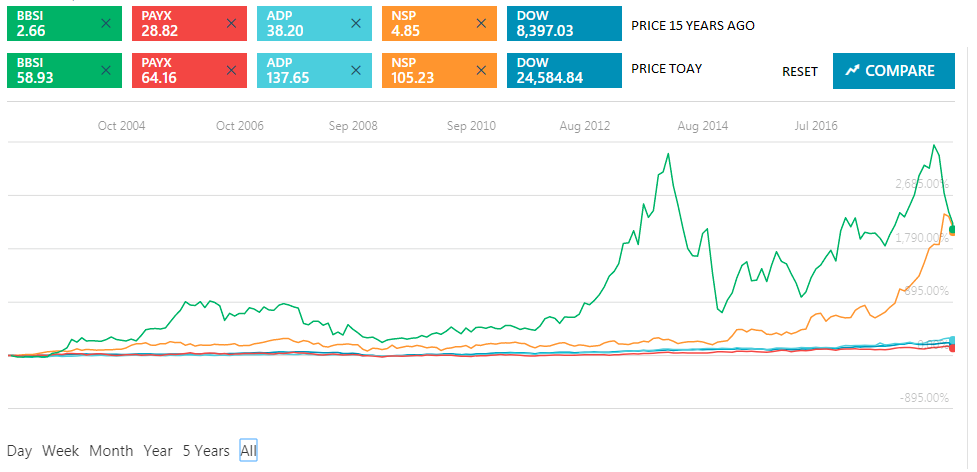
Below, in the one year, five year, and fifteen year trending charts, TriNet (TNET) is not present. This is due to the fact that TriNet didn’t become public until 4.5 years ago. However, as a major player within the PEO industry, TriNet will be represented in further graphs and figures under the Public PEO Financials section of this article. Moreover, ADP and Paychex trending includes their payroll segments of the company earnings. However, with ADP and Paychex, the PEO portion of their business will be separated under the Public PEO Financials section of this article.
Please note, all investments are subject to certain risks and investment considerations with private PEOs should include appropriate due diligence.
One Year Trending
Five Year Trending
Fifteen Year Trending
Public PEO Financials
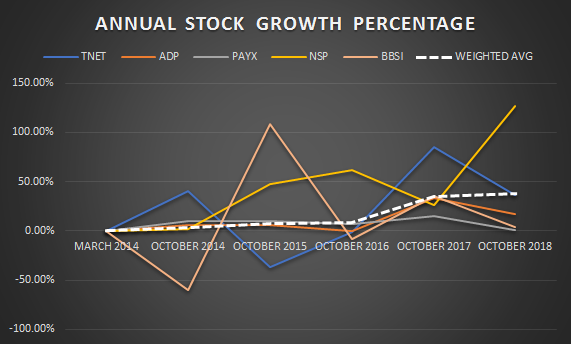
The following data is pulled from the SEC filings released by the following PEOs: ADP TotalSource (ADP), Insperity (NSP), TriNet (TNET), Paychex (PAYX), and Barrett Business Services (BBSI). Figure 2 illustrates the stock price trending and stock price growth percentages for publicly traded PEOs over the last 4.5 years. The graph in Figure 3 illustrates stock price trending on an annual basis for public PEOs over the past 4.5 years. The graph in Figure 4 illustrates publicly traded PEOs stock price growth percentages on an annual basis over the past 4.5 years.
Figure 2
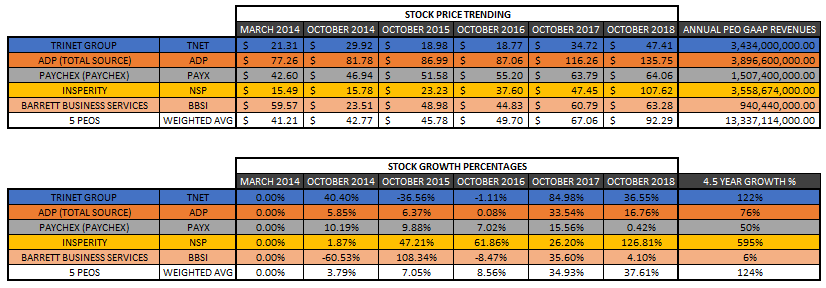
Please note that the Annual PEO GAAP Revenues were pulled from the SEC filings of the above PEOs in the following formats:
TriNet: trailing 4 quarters ending Q3, 2018. ADP: Fiscal year ending Q2, 2018 – TotalSource number illustrated above was pulled from ADP filings. Paychex: Fiscal year ending Q2, 2018 – Paychex HRS number illustrated above was pulled from PAYX filings. Insperity: trailing 4 quarters ending Q2, 2018. Barrett Business Services: trailing 4 quarters ending Q2, 2018 (BBSI numbers include their staffing revenues)
Figure 3
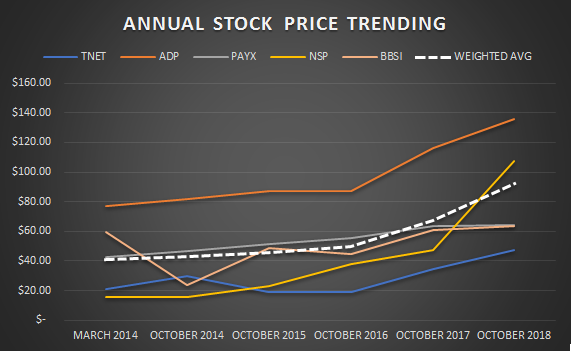
Figure 4
Are PEOs a Good Investment?
Over the last 4 ½ years, the weighted average of PEO stock price growth has increased by 124%. By comparison, the Dow Jones Industrial Average has increased in the same time frame by 52%.
When the United States experienced the Great Recession, the PEO industry only had one negative year over year revenue growth year of -3.9% in 2009. This one-year reduction wasn’t due to lack of new client growth but rather a reduction in same store sales due to existing clientele reducing workforce, hours, and/or wages during the great recession. Many PEOs continued to add new clients during the last economic downturn. Moreover, with an estimated PEO market penetration rate in the United States under 15%, the industry has more opportunity for growth and expansion.
With any investment choice, investors should weigh the risk factors prior to investing. Historically, the PEO industry has rebounded quickly from recessed economic conditions and continued to grow new business during a down economy. Also, the weighted average of the publicly traded PEOs have outpaced the Dow Jones Industrial Average in the last five years in growth percentages. However, every Publicly traded PEO hasn’t performed the same. Some have trended consistently while others have experienced some volatility within their stock price trending. There is not a composite PEO investment available. Therefore, investors should research each PEO individually to determine the appropriate investment(s) and timing of said investment(s).
Experts believe the PEO industry is in a growth stage. If this proves true, publicly traded PEOs may experience increased market-cap growth over the coming years.
Privately held PEOs were not represented in this article. The most notable private PEO is Oasis Outsourcing which is estimated to be one of the top 5 largest PEOs in the nation.
Author:
Rob Comeau is the featured Author of NetProftGrowth and CEO of Business Resource Center, Inc., a business consulting and M&A advisory firm to the PEO industry.
