
This article provides a snapshot of industry statistics for health insurers and workers’ compensation insurers in the United States. It will provide a macro overview on each industry, growth and profitability for each line. This article does not cover loss ratios or segregate each industry by insurer.
Health Insurer Industry Statistics
Revenue, Profit and Growth Rate
For 2017, projected total gross revenues are $784.9bn with an annual projected profit of $37.7bn resulting in 4.80% profit as a percentage of revenues. The annual grow rate from 2012 through 2017 was 2.4%. The industry is projected to achieve an annual growth rate from 2017 through 2022 of 1.2%. [i]
Products & Services Segmentation
The segmentation for the industry is as follows:

Source: IBISWorld
Industry Overview
The medical insurer industry is in the Mature life cycle stage. The regulation level is Heavy with barriers to entry High. Revenue volatility is Medium yet completion levels are High. Technology change is Medium with industry globalization being Low. [ii]
Revenue Growth
| Year | Revenue $ million | Growth % |
| 2005 | 561,073.6 | 0.0 |
| 2006 | 568,333.8 | 1.3 |
| 2007 | 580,842.3 | 2.2 |
| 2008 | 647,041.0 | 11.4 |
| 2009 | 615,326.6 | -4.9 |
| 2010 | 610,046.8 | -0.9 |
| 2011 | 631,052.3 | 3.4 |
| 2012 | 698,900.7 | 10.8 |
| 2013 | 716,877.8 | 2.6 |
| 2014 | 700,759.9 | -2.3 |
| 2015 | 763,468.2 | 8.9 |
| 2016 | 778,510.0 | 2.0 |
| 2017 | 784,938.2 | 0.8 |
Source: IBISWorld
Outlook
Healthcare costs are expected to continue to rise, driven predominantly by medical cost inflation. Prescription drug expenditures are projected to increase by an annualized rate of 6.2% over the next five years.
Workers’ Compensation Insurer Industry Statistics
Revenue, Profit and Growth Rate
For 2016, total gross revenues are $54.4bn with an annual profit of $5.3bn resulting in 9.74% profit as a percentage of revenues. The annual grow rate from 2012 through 2016 was 5.7%. The industry is projected to achieve an annual growth rate from 2016 through 2021 of 3.0%. [iii]
Industry Overview
The workers’ compensation insurer industry is in the Mature life cycle stage. The regulation level is Heavy with barriers to entry High. Revenue volatility is Medium yet completion levels are High. Technology change is Medium with industry globalization being Low. [iv]
Major Market Segmentation
The industry serviced market segmentation is as follows:
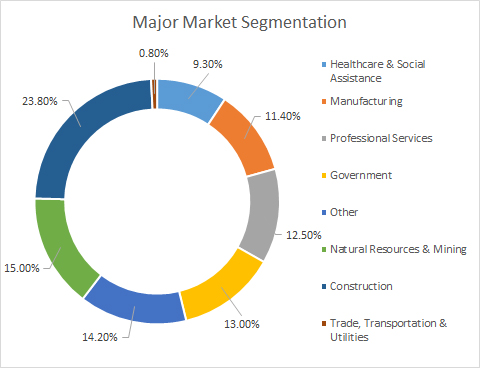
Source: IBISWorld
Revenue Growth
| Year | Revenue $ million | Growth % |
| 2004 | 43,805.3 | 0.0 |
| 2005 | 44,746.5 | 2.1 |
| 2006 | 49,185.4 | 9.9 |
| 2007 | 48,538.1 | -1.3 |
| 2008 | 37,015.0 | -23.8 |
| 2009 | 31,138.6 | -15.9 |
| 2010 | 38,089.8 | 22.3 |
| 2011 | 41,145.7 | 8.0 |
| 2012 | 42,563.1 | 3.4 |
| 2013 | 48,319.8 | 13.5 |
| 2014 | 51,019.6 | 5.6 |
| 2015 | 53,126.6 | 4.1 |
| 2016 | 54,365.5 | 2.3 |
Source: IBISWorld
Workers’ Compensation Volatility Per State
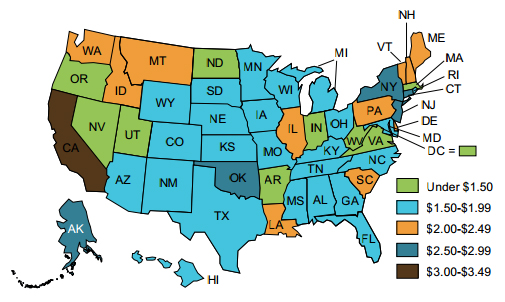
Source: Insurance Journal
[i] IBISWorld Industry Report 52411b
[ii] IBISWorld Industry Report 52411b
[iii] IBISWorld Industry Report OD4781
[iv] IBISWorld Industry Report OD4781
Author: Rob Comeau is the CEO of Business Resource Center, Inc. a management consulting and M&A advisory firm with a focus in the PEO industry. For more information on Business Resource Center, Inc., please visit them on the web at www.biz-rc.com.