
PEO Stats
A recent industry report was released by IBISWorld on the PEO industry with updated statistics through March of 2019. This article is a snapshot of the highlights contained within that report followed with commentary by www.netprofitgrowth.com author and CEO of Business Resource Center, Rob Comeau.
Fast Facts
The PEO industry gross revenue for 2019 is estimated to be $217.2bn, of which an estimated $186.9bn represents work site employee (WSE) wages. Projected profit for the PEO industry in 2019 is $1.3bn. The annual growth rate from 2014 through 2019 in the PEO industry is estimated at 8.0%.[i]
For the first time ever, the PEO industry eclipsed $200bn in total gross revenues in 2018.
Industry Structure
According to the report, it states that the industry life cycle stage is growth with revenue volatility being medium. Regulation is medium within the industry and barriers to entry are also considered medium. Competition levels are considered high while concentration level remains low and industry globalization is low.[ii]
Historic Industry Growth
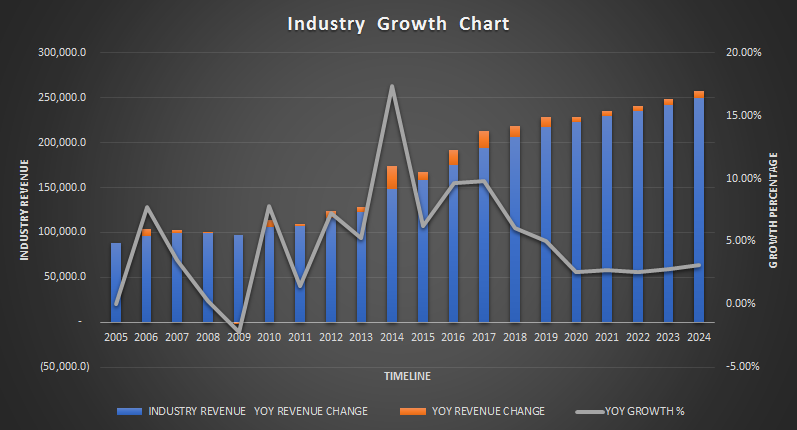
Figure 1 illustrates the PEO industry growth from 2005 through 2018 along with forecasted growth through 2025. As noted from previous reports, 2009 was the only negative growth year.[iii] Figure 2 illustrates the industry’s growth by gross revenue with a year over year growth percentage overlay.
Figure 1
PEO Industry Historic and Projected Gross Revenues
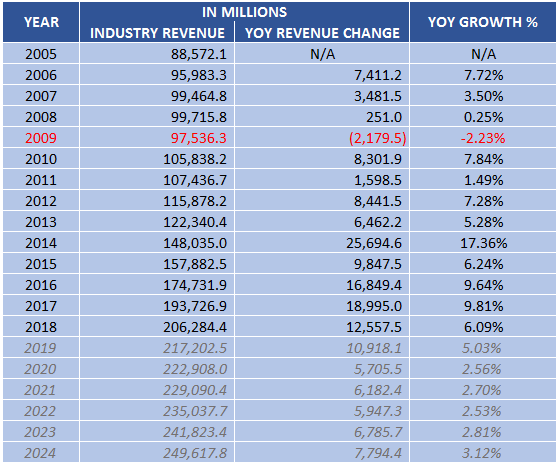
Figure 2
Revenue, growth, and growth percentages by year for the PEO industry
Projected Growth Rate
The reports illustrates projected future growth for the industry between 2019 and 2024 of 2.8% annually. [iv]
Market Segmentation
The market segmentation in the report shows the industry is roughly 2/3 white collar focused as illustrated in figure 3.
Figure 3

Market Segmentation according to the IBISWorld Report
Opinion/Commentary
The data in this article was pulled from the IBISWorld Industry Report 56133, Professional Employer Organizations in the United States, dated March 2019. The below commentary is solely the opinion of the blog author; Rob Comeau, with respect to the information pulled from the report.
Industry Growth
The IBISWorld report has revised its projected growth rate from 0.40% in its last report to 2.8% in this newest edition. This new estimate is more in line with what we predicted (between 1% and 3% annual growth) in the commentary section of our analysis of the last report.
The economy will play a factor in growth predictions through 2024. The United States has been in a bull market for 10 years (as of March 2019) which is considered by many to be the longest bull market in history. It is the opinion of this author that a correction is coming soon. If a correction keeps getting delayed too long, a potential collapse is possible.
Moreover, regulatory shifts will also be a variable in the industry’s future growth. I would estimate an annual growth rate for the industry, through 2024, of between 2.5% and 3.5% with some potential revenue volatility within that time span.
Major Players
The IBISWorld report states that ADP, Insperity, and TriNet are the major competitors within the industry. A more complete list of the top players would best be categorized in tiers. The top tier of major publicly traded players would include ADP Totalsource, Insperity, TriNet, Paychex/Oasis, and BBSI. The next tier of larger players would include CoAdvantage and Vensure. From there the list would include super regionals and National players such as G&A Partners, SEPLI, Avitus, ProService, GMS, FrankCrum, Landrum, Engage PEO, MBA and others.
Profit Margins
The IBISWorld report estimates gross revenues of $217.2bn with industry profit of $1.3bn. That equates to a profit margin as a percent of gross revenues of 0.60% which is in line with NAPEO’s 2017 FROS survey median for that metric of 0.60%.
Market Outlook
M&A and Revenue Distribution
We continue to see a market consolidation with M&A activity. The most notable recent acquisition was that of Oasis Outsourcing by Paychex. Consolidation is expected to continue within the industry in the foreseeable future. Moreover, while the industry remains fragmented with relatively low market penetration, gross revenue continues to be consolidated by the top 20 players within the industry. Most acquisitions that are being made are by large PEOs and private equity firms. There remains a strong interest in the PEO industry by the investment community and this trend is expected to continue.
Primary Growth Variables
The two main variables that will likely have an impact on future revenues continue to be the economy and regulatory environment. If the economy shifts downward, the industry could experience minimal growth, or a slight decline for 12 to 18 months, followed by rebounding revenue if history is any indication. Moreover, any major regulatory shifts which require SMB compliance will likely bode well for the PEO industry due to compliance assistance provided by the PEO.
Insurance
Workers’ compensation markets and volatility vary from State to State but Health Care inflation is universally impacting PEOs and SMBs within the United States. This inflation is expected to continue for the foreseeable future.
CPEO
The CPEO initiative has gained solid traction and continues to remain a voluntary vehicle for PEO firms.
Unemployment
Unemployment remains low which is a plus for the PEO industry on three fronts. 1) low unemployment can help with better revenue predictability for PEOs. 2) low unemployment can lead to lower SUTA rates for PEOs. 3) low unemployment can help lessen post termination WC claims for PEOs. While low unemployment does not eradicate these issues for PEOs, it typically is a better environment for PEOs in these areas than high unemployment rate.
Public PEO Stock Trending (year to date as of 6/30/19)
ADP
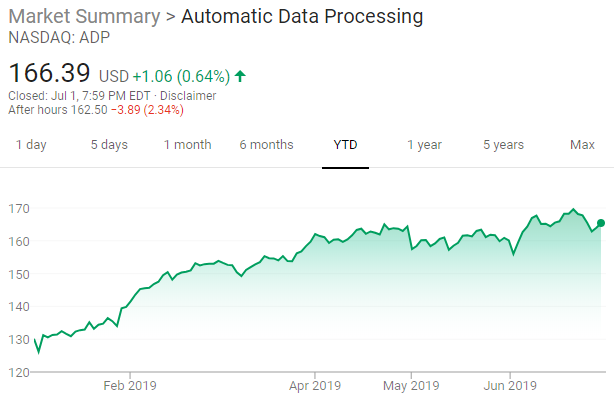
ADP year to date stock trending through 6/30/19.
PAYX
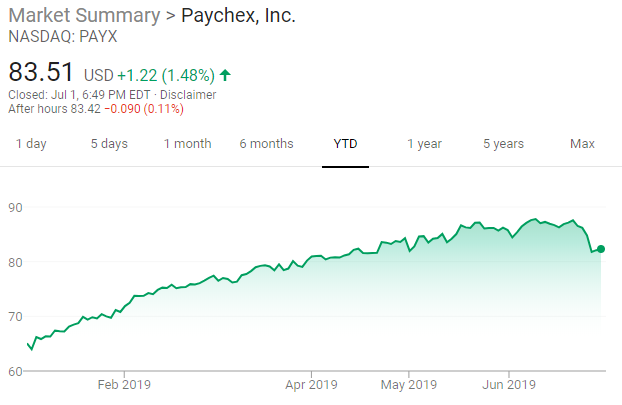
PAYX year to date stock trending through 6/30/19
TNET
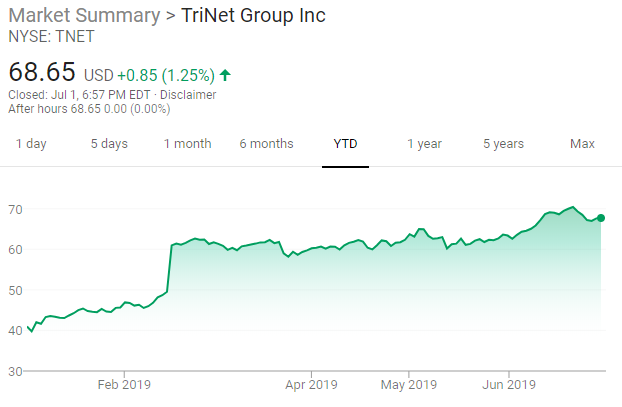
TNET year to date stock trending through 6/30/19
NSP
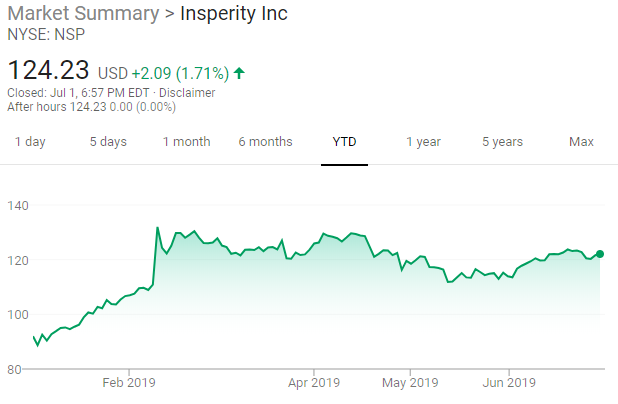
NSP year to date stock trending through 6/30/19
BBSI
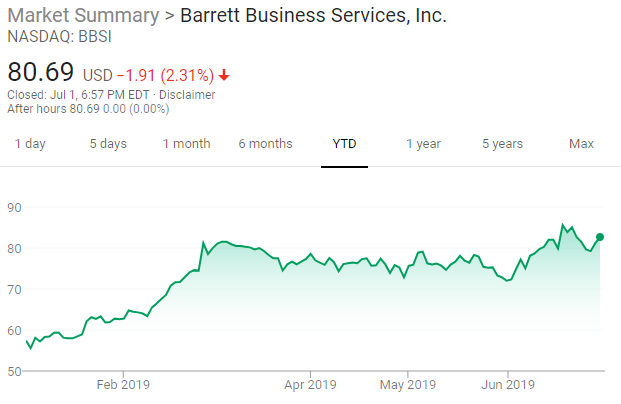
BBSI year to date stock trending through 6/30/19
Author
The source for the report synopsis was the IBISWorld Industry Report 56133. The subsequent commentary was provided by this site’s featured Author and CEO of Business Resource Center, Inc., Rob Comeau.
[i] IBISWorld Industry Report 56133, Professional Employer Organizations in the United States
[ii] IBISWorld Industry Report 56133, Professional Employer Organizations in the United States
[iii] IBISWorld Industry Report 56133, Professional Employer Organizations in the United States
[iv] IBISWorld Industry Report 56133, Professional Employer Organizations in the United States
PEO Industry Statistics, PEO Industry Statistics, PEO Industry Statistics, PEO Industry Statistics, PEO Industry Statistics, PEO Industry Statistics.