Disclaimer: All information contained within this article was pulled from public record and includes stock trending, financial information, and published employee reviews from public sources as of 1/18/19. The information contained within this article should not be construed as investment advice.
Publicly Traded Professional Employer Organizations (PEOs)
There are currently five large publicly traded PEOs; ADP TotalSource, Paychex, Insperity, TriNet, and BBSI. This article will provide an overview of stock trending, market caps, P/E Ratio, stock performance versus major market indexes, Glassdoor reviews, three year revenue trending, and commentary. The combination of this information is what is used to provide the overview of the publicly traded PEOs in the market.
Stock Information
Below is an outline of each PEO’s market cap, P/E ratio, and trading performance for the trailing twelve months (TTM). The market cap is the current stock price multiplied by its outstanding shares. As a point of reference regarding P/E ratios: Generally a high P/E ratio means that investors are anticipating higher growth in the future. The average market P/E ratio is 20-25 times earnings. The P/E ratio can use estimated earnings to get the forward looking P/E ratio. Companies that are losing money do not have a P/E ratio. – Investopedia
| PEO | MARKET CAP | P/E RATIO | 52 WEEK HIGH | 52 WEEK LOW | CURRENT |
| ADP TOTALSOURCE | 59.22B* | 36.97 | 153.51 | 107.61 | 135.13 |
| PAYCHEX (PAYX) | 25.12B* | 26.12 | 76.02 | 59.36 | 69.95 |
| INSPERITY (NSP) | 4.23B | 48.69 | 121.15 | 55.4 | 101.21 |
| TRINET GROUP (TNET) | 3.21B | 18.28 | 60.15 | 38.26 | 45.59 |
| BARRETT BUSINESS SERVICES (BBSI) | 0.43B | 16.83 | 98.76 | 53.1 | 58.69 |
| *Market cap includes payroll segment of business. Estimated market caps for the PEO/HRS segment is much lower. Company financials, segregated by the PEO/HRS segment are illustrated later in this article and will be a better reflection of size as it pertains to the PEO/HRS segment. | |||||
Commentary
ADP TotalSource is the largest among publicly traded PEOs while Insperity has the highest P/E ratio. Insperity is trading at 14.65% higher above its TTM midpoint which leads the peer group. Current trading values were pulled on 1/18/19.
Note: Paychex numbers do not reflect the acquisition of Oasis Outsourcing, Inc. Their numbers will likely shift once the financials for Oasis are included in their next filing.
The stocks for the majority of publicly traded PEOs have trended in a positive direction over the TTM.
Stock Trending Charts
ADP
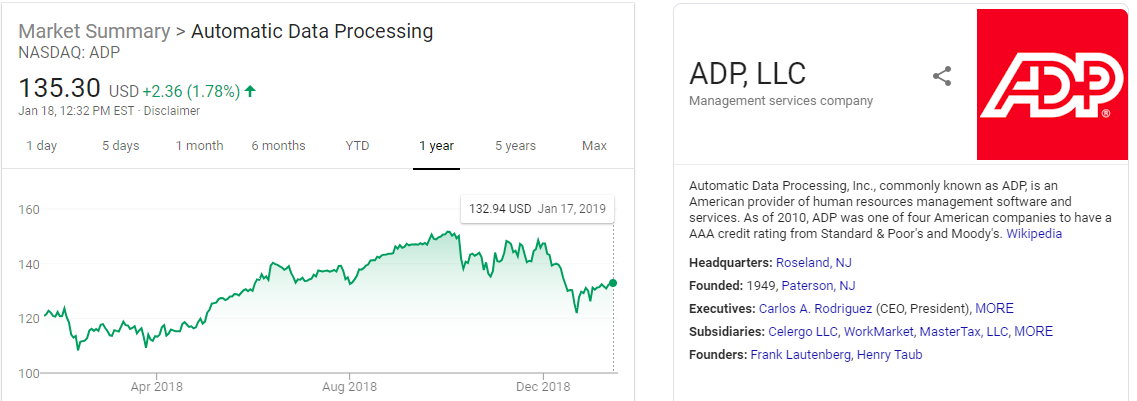
ADP TTM Stock Trending as of 1/19/19
Paychex
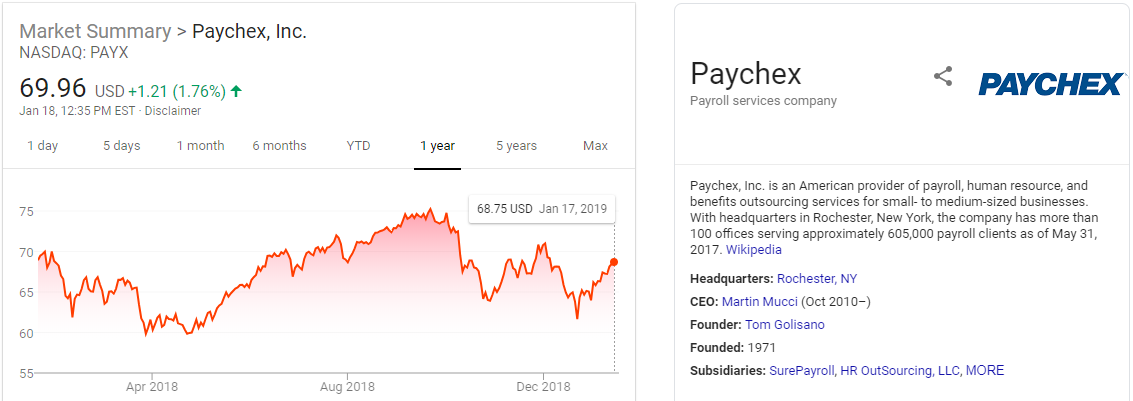
PAYX TTM Stock Trending as of 1/19/19
Insperity
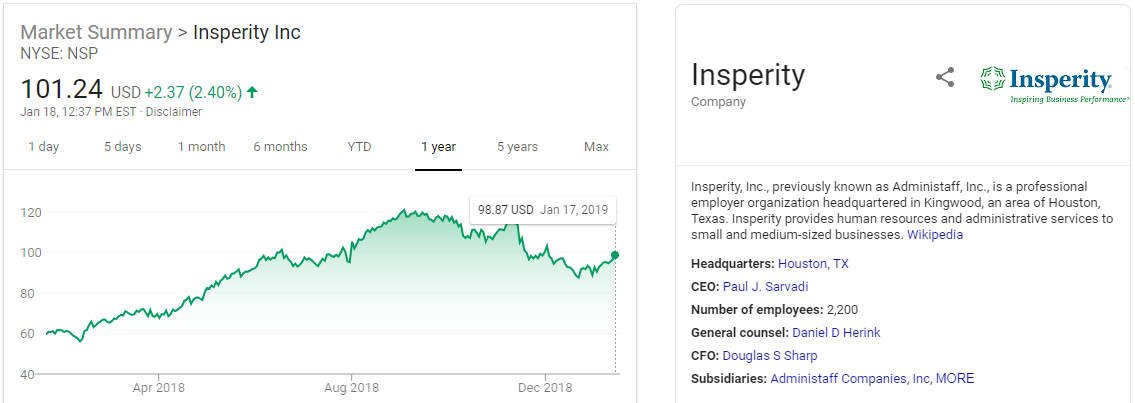
NSP TTM Stock Trending as of 1/19/19
TriNet
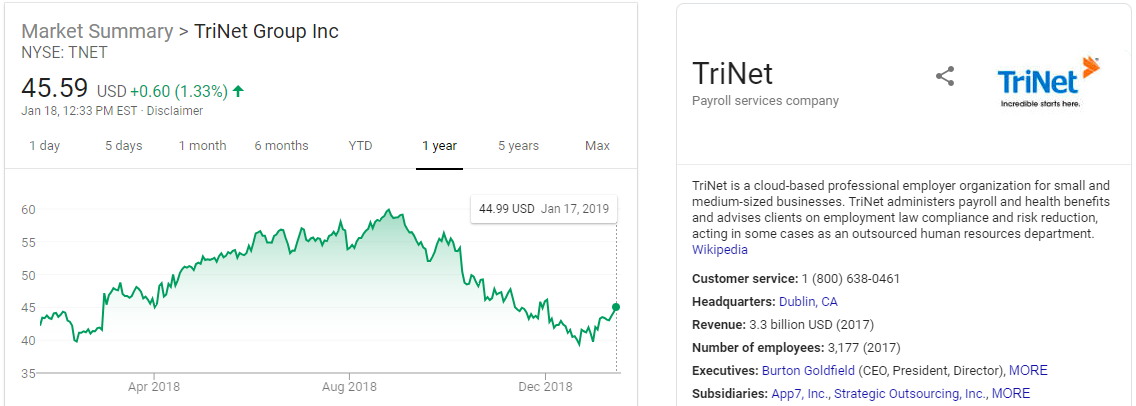
TNET TTM Stock Trending as of 1/19/19
BBSI
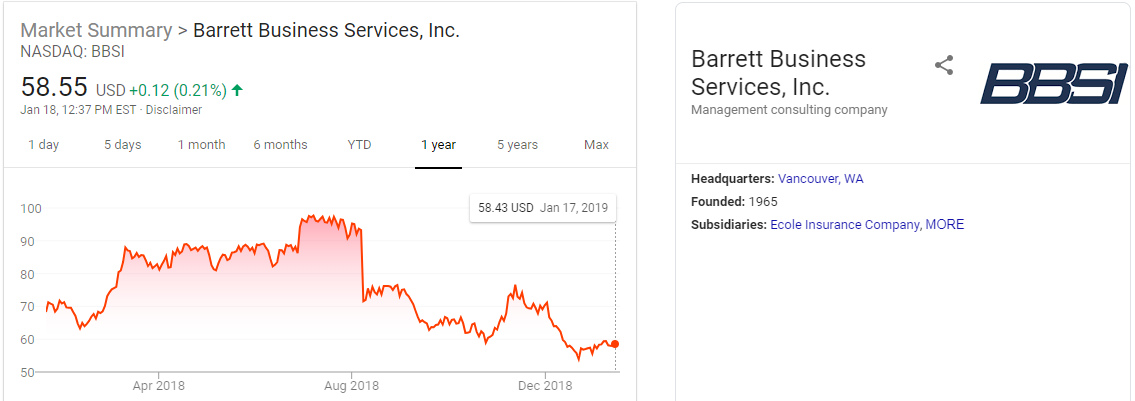
BBSI TTM Stock Trending as of 1/19/19
Stock Index Comparison/Reference
Dow Jones
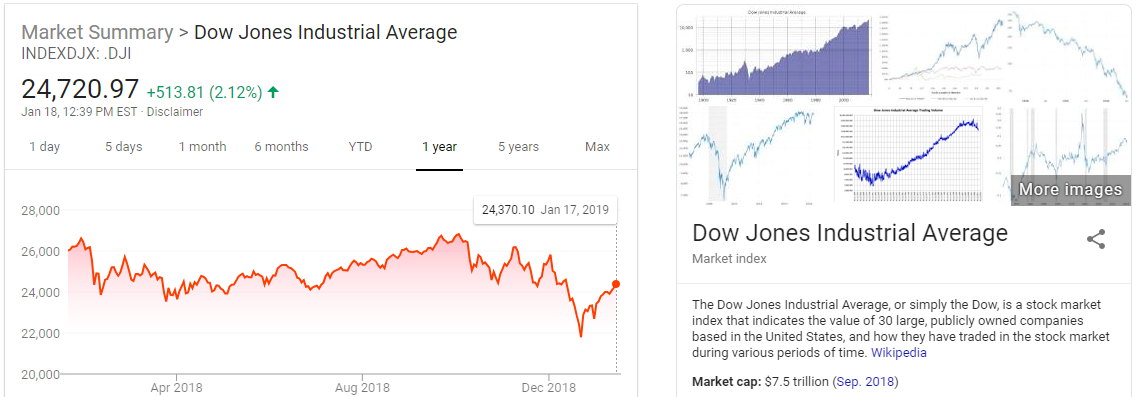
Dow Jones TTM Stock Trending as of 1/19/19
S&P 500
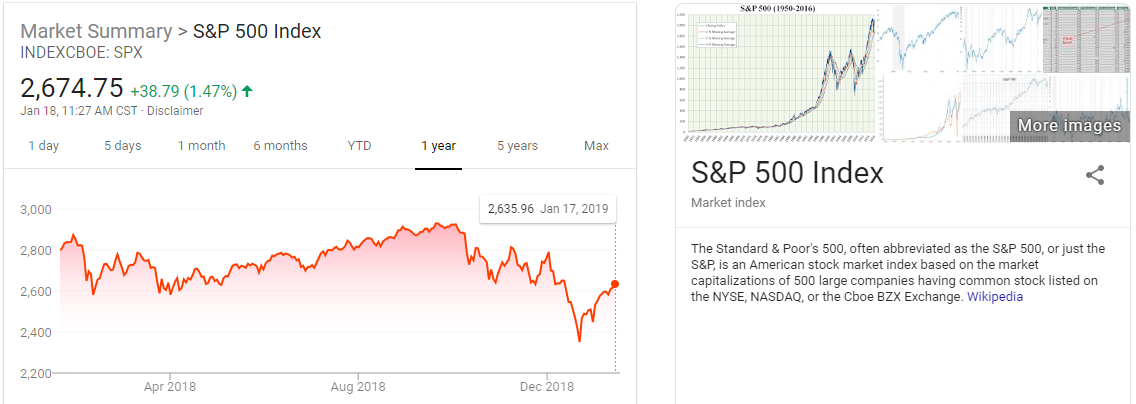
S&P 500 TTM Stock Trending as of 1/19/19
NASDAQ Composite
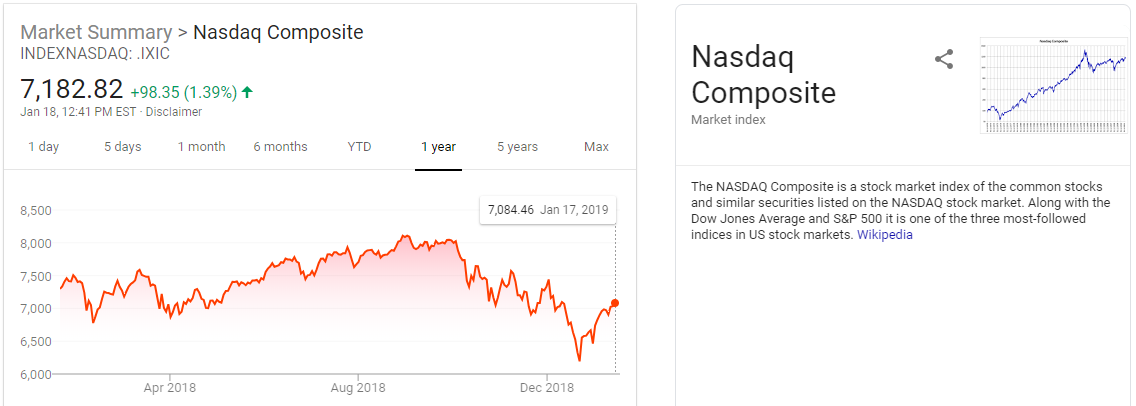
NASDAQ Composite TTM Stock Trending as of 1/19/19
Publicly Traded PEO Glassdoor Reviews

ADP Glassdoor reviews as of 1/18/19

Paychex Glassdoor reviews as of 1/18/19
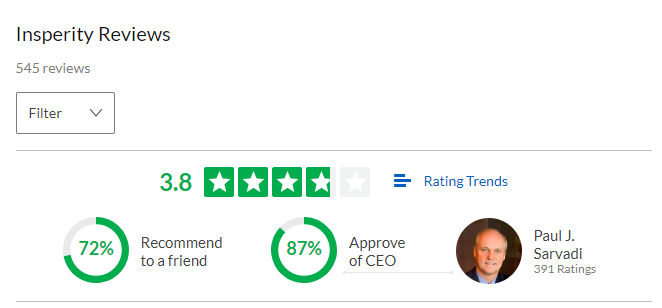
Insperity Glassdoor reviews as of 1/18/19
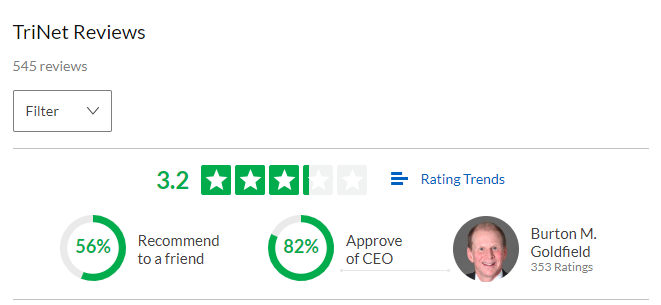
TriNet Glassdoor reviews as of 1/18/19
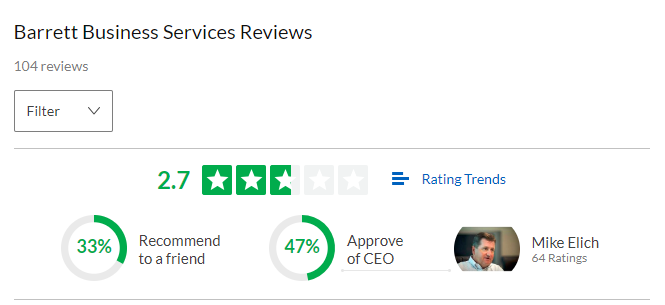
BBSI Glassdoor reviews as of 1/18/19
Commentary
Paychex is leading the way with the highest rankings in all three categories.
- Star rating (3.9 out of 5)
- Recommend to a friend (75%)
- CEO Approval Rating (90%)
Insperity was a close 2nd at 3.8, 72%, and 87% respectively.
As a point of reference, considering Paychex just recently acquired the formerly largest privately held PEO Oasis Outsourcing, the rankings for Oasis are listed below.
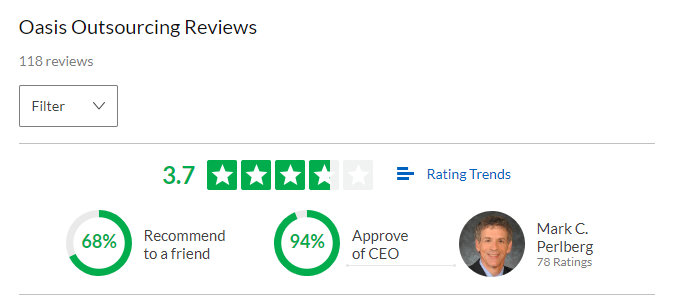
Oasis Glassdoor reviews as of 1/18/19
| GLASSDOOR REVIEWS (1/18/19) WRAP UP AND COMPOSITE RATING | ||||
| PEO | STAR RATING | RECOMMEND | CEO RATING | COMPOSITE RATING |
| PAYX | 3.9 | 75 | 90 | 81 |
| 78% | 75% | 90% | 81% | |
| OASIS | 3.7 | 68 | 94 | 79 |
| 74% | 68% | 94% | 79% | |
| INSPERITY | 3.8 | 72 | 87 | 78 |
| 76% | 72% | 87% | 78% | |
| ADP | 3.6 | 69 | 85 | 75 |
| 72% | 69% | 85% | 75% | |
| TRINET | 3.2 | 56 | 82 | 67 |
| 64% | 56% | 82% | 67% | |
| BBSI | 2.7 | 33 | 47 | 45 |
| 54% | 33% | 47% | 45% | |
Financial Performance
| PEO REVENUE NUMBERS (NUMBERS IN MILLIONS) | ||||
| PEO | 2015 | 2016 | 2017 | GROWTH % |
| PAYCHEX (PAYX) | 1,175.9 | 1,321.4 | 1,507.4 | 28.19% |
| ADP TOTALSOURCE (ADP) | 3,073.1 | 3,483.6 | 3,896.6 | 26.80% |
| INSPERITY (NSP) | 2,603.6 | 2,941.3 | 3,300.2 | 26.76% |
| BARRETT BUSINESS SERVICES (BBSI) | 740.1 | 840.1 | 920.4 | 24.36% |
| TRINET GROUP (TNET) | 2,659.0 | 3,060.0 | 3,275.0 | 23.17% |
| Information was pulled from the three most recent 10K filings per company. (Revenue numbers for ADP and Paychex were for the PEO/HRS segments only and exclude payroll service numbers). | ||||
Final Commentary
Review
The majority of publicly traded PEOs have outperformed indexes and most are trading above the midpoint of their 52 week high/low. The majority of PEOs have a positive composite rating based on feedback from current/former employees on Glassdoor.
Stock and Revenue Growth
The stock market has been a bouncing ball lately with dips and gains. However, as history shows, a bull market will not last forever. When the market does correct, PEOs historically have been resilient to economic downshifts as noted on our PEO Industry Statistics articles. The majority of P/E ratios suggest that the investment community expects continued growth in the segment. Publicly traded PEOs have experienced between 23.17% to 28.19% for revenue growth between 2015 to 2017.
While the PEO industry is fragmented, revenue distribution is more consolidated. The midpoint of revenue growth between publicly traded PEOs is just over 25% from 2015 to 2017 numbers. This equates to an annual average growth of roughly 12.5%. Even with a potential economic downshift, where same store sales will likely reduce, PEO industry revenues are expected to experience gains over the next five years due to new business added.
Likely Revenue Adjustment in 2019 due to Oasis Acquisition
At the time of the Paychex acquisition, it was reported that Oasis Outsourcing had 8,400 clients. It is likely that this will add between $1B and $1.5B to the Paychex PEO/HRS revenues illustrated in the Financial Performance section of this article, though this is purely speculation. We won’t know the true impact on revenue until they file a quarterly report with Oasis included in the financials to provide a base of reference in 2019.
Author

Author: Rob Comeau
Rob Comeau is the CEO of Business Resource Center, Inc., a business consulting and M&A advisory firm. To learn more about Business Resource Center or to contact Rob, please visit www.biz-rc.com.