
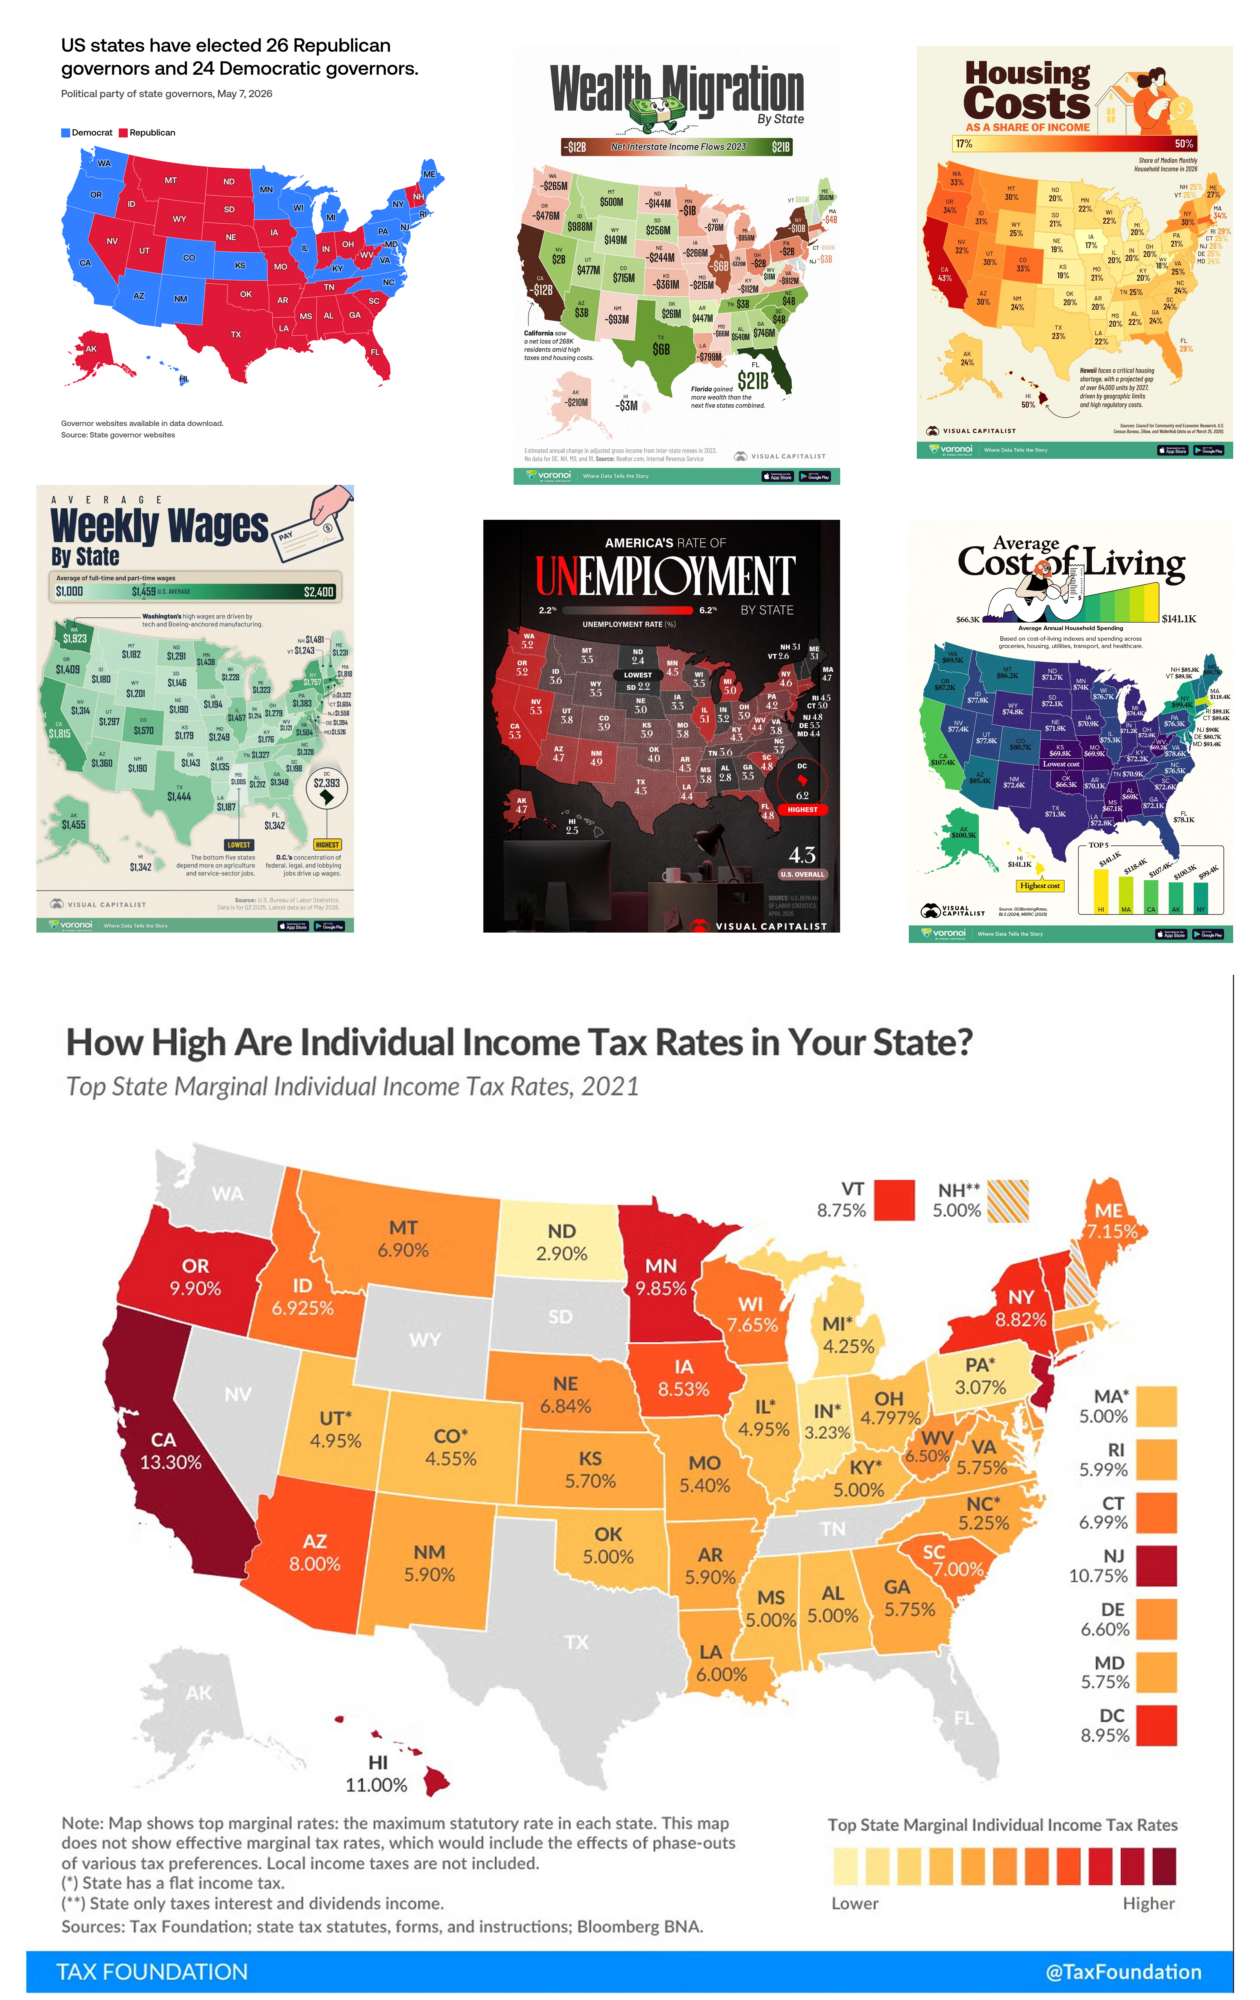
This article is a review on the financial aspects of living in each State. We took six primary categories that affect the population with affordability and give insight into drivers behind State by State wealth movement. The categories measured for this exercise were the following:
- Wealth Migration
- Housing Costs as a Percentage of Income
- Weekly Average Wages
- Unemployment Rates
- Cost of Living
- State Income Tax
We also overlayed the political parties via Governor by State to identify if there is any discernable trending.
State Maps Financial Performance
Directly below are the 7 categorical criteria maps for review.
State Performance Rankings
After reviewing the mapped data, we put the date into spreadsheet format and filtered to determine the top 5 best and worst performing States by category. We then filtered this list by the net value of top 5 positive versus top 5 negative to determine the positive/negative net value for each State.
Click on the image below to expand in needed.
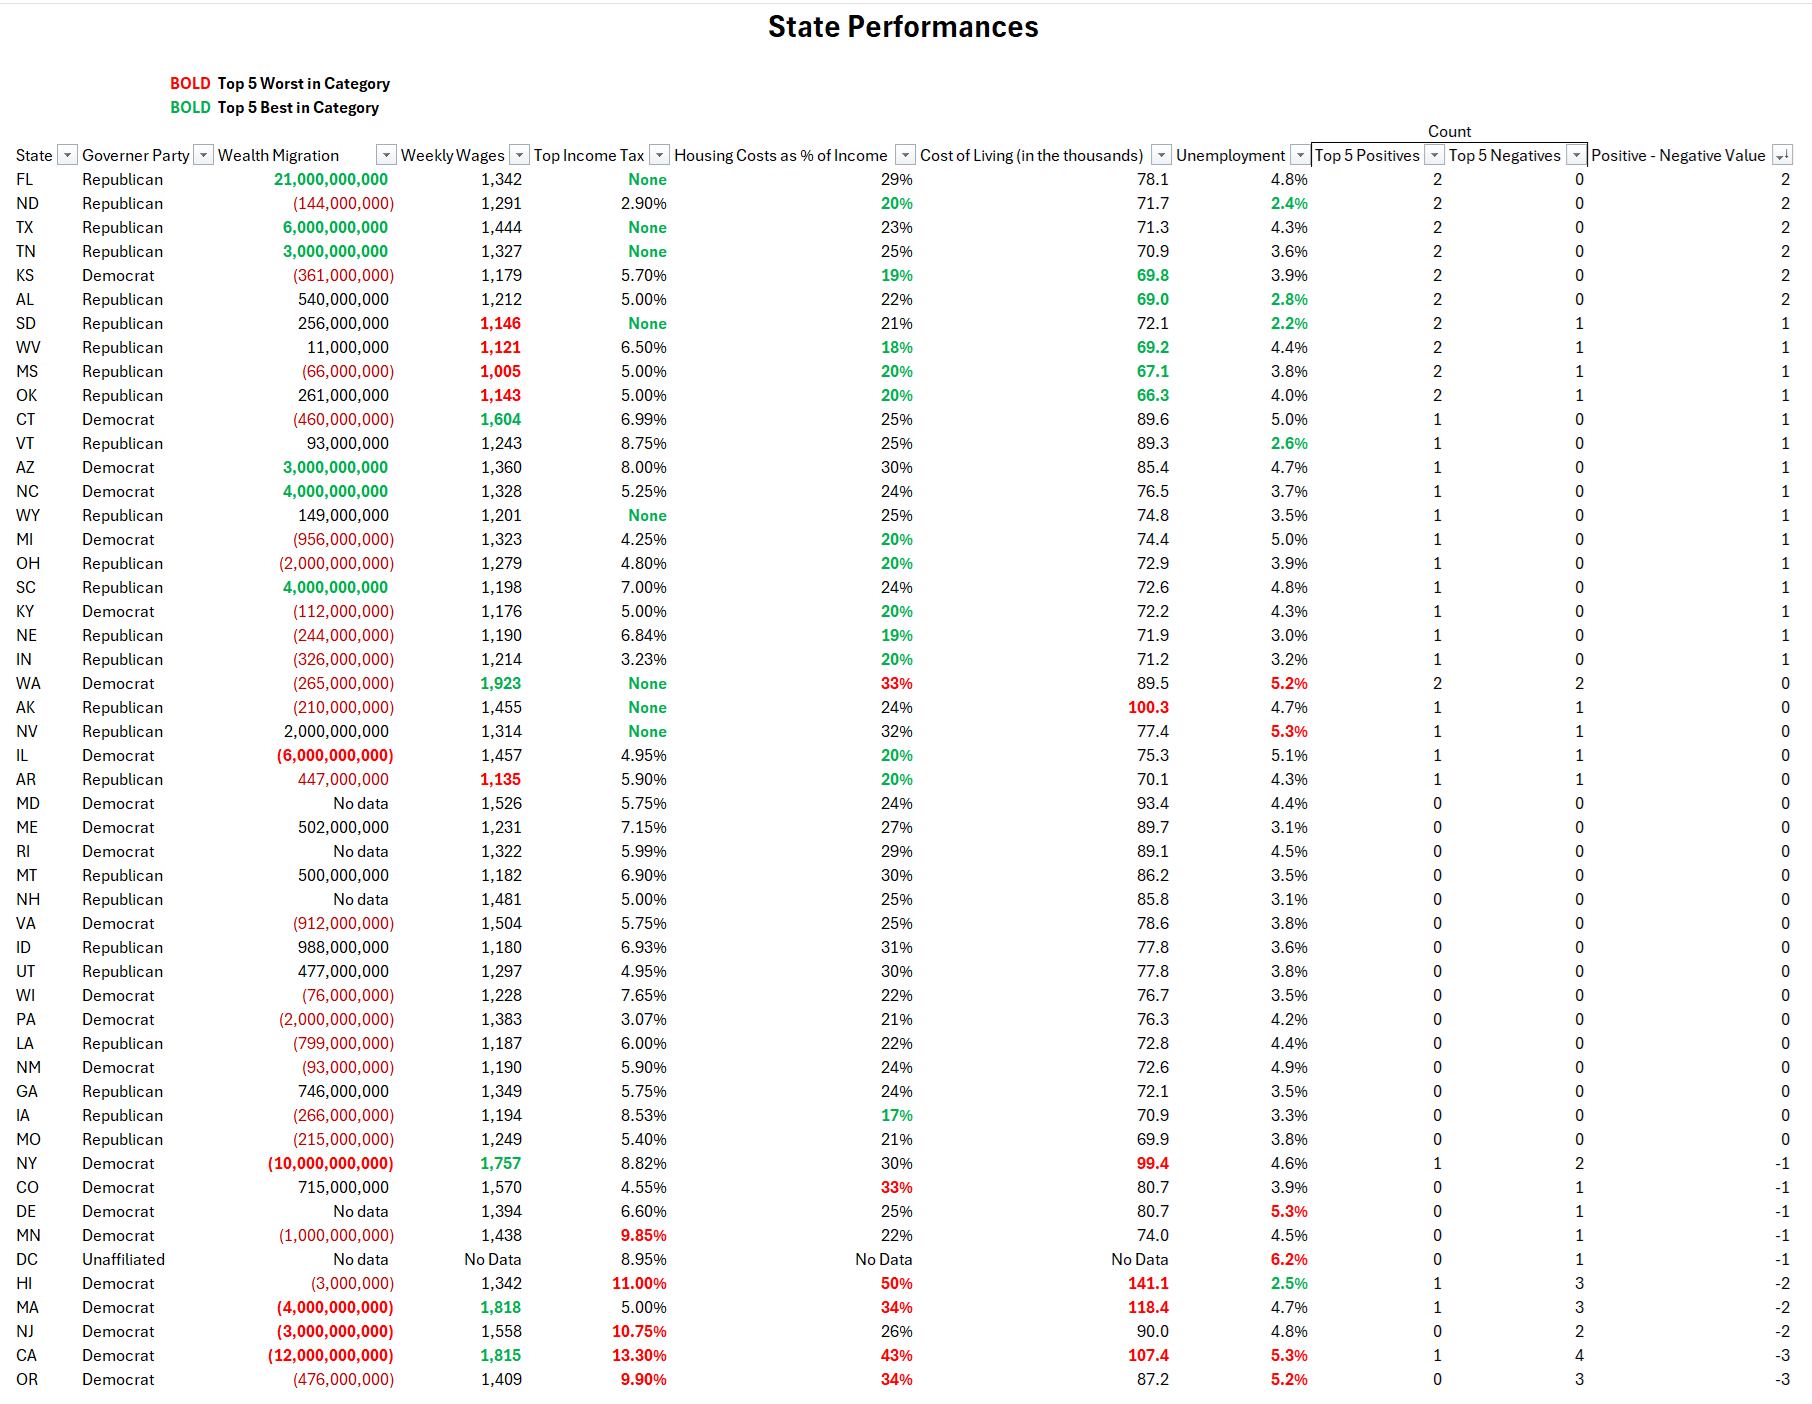
Winners/Losers
The Top Winners for net value were:
- Florid
- North Dakota
- Texas
- Tenessee
- Kansas
- Alabama
The Top Losers for net value were:
- California
- Oregon
- New Jersey
- Massachusetts
- Hawaii
Summation
Many of the categories we reviewed in this study affect everyday people, i.e. Average Wages, Unemployment, Housing Costs, Cost of Living, income taxes, etc. Other areas studies illustrate State policy affects on wealth migration, which also impact everyday people via job availability and wages. Of course other factors play into where people choose to live such as weather, crime, etc. but this study should provide you with insight into which States may be most appealing for your family and/or business.
Author

Rob Comeau is the CEO of Business Resource Center, Inc. He consistently reviews economic trending to better understand economic cyclicality as it impacts everyday people.